
Any search on the web you find will consistently show log4net outperforming EL by a factor of around 4:1. Most of these tests are typically tight for/loops, and comments will end up saying things like “oh well that’s not a realistic test” or “well you shouldn’t be logging that much anyway”, etc etc. Well, let’s see how important choosing your logging infrastructure is in terms of overall system performance in a multithreaded application.
One of my recent tasks was hunting down a memory leak. So I downloaded the trial of the ANTS .NET Bundle which contains a memory profiler and performance profiler. Hunting the memory leak was a pain since I wasn’t the one who wrote the code, so it took a while for me to realize which objects were “leaked.” I eventually found it, and then I turned my attention to using the performance profiler to see if any obvious places could be optimized.
At this point I decided to swap in the Enterprise Logging Block to see how it would fair. The logging migration project was still in progress, and we haven’t made the full switch yet, but I figured I should try out it anyway because I’m the curious type.
The software already uses the Trace diagnostics extensively. Practically every message, error, you name it, will get Trace.WriteLined…and then a LogFileWriter will pick it up, and dump it to a file. In my testing, I simply added an extra line of code here, namely Logger.Write(LogEntry). Thus, anything that used to get logged, will also get logged by the EL.
Then, it was basically running the application to a similar set of scenarios, and then seeing what the profiler says. Obviously each run will not be exactly the same as the previous, but overall I think if we look at percentages we can begin to see where the CPU is taking the most time.
Here is what the application does without any modifications.
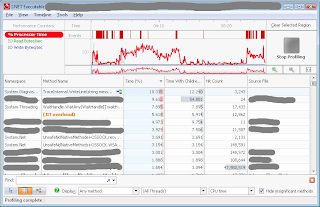
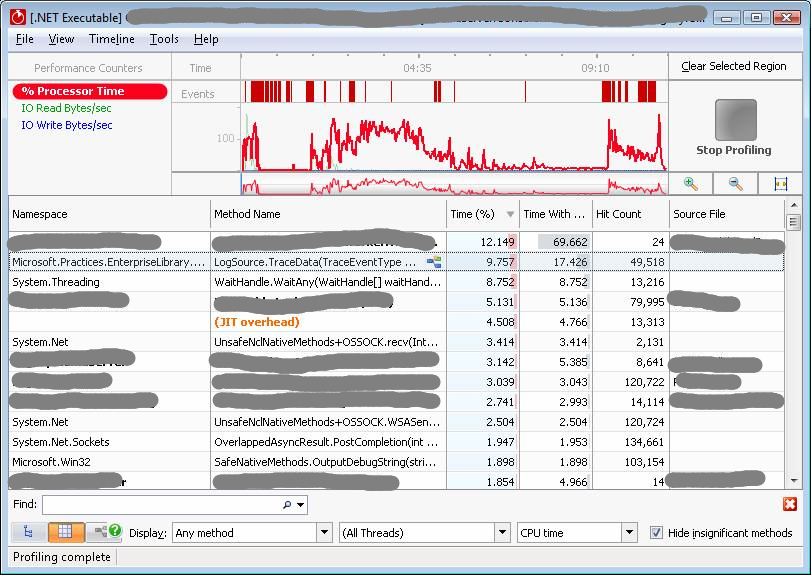
Here is the application after adding Logger.Write(LogEntry).

Yeah, I was pretty surprised too. That one method ended up being the most expensive method in the entire application.
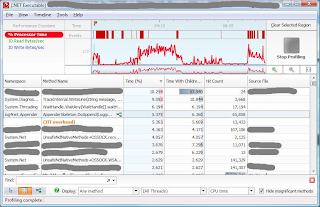
A quick look at the source revealed quite a bit of code dedicated to thread safety. So digging deeper, I decided to avoid the static Logger.Write method altogether, create instance LogWriters directly, and have them all go to a singleton FileTraceListener.

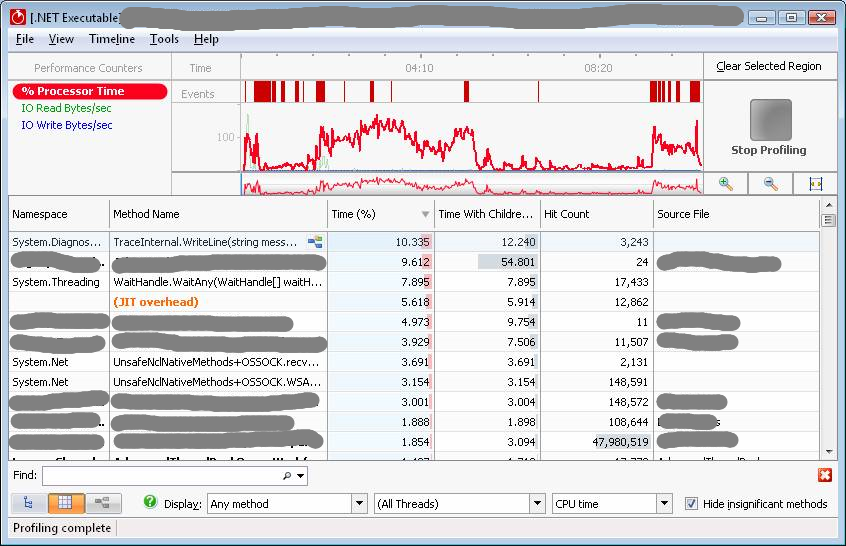
That’s a noticeable improvement…it’s not #1 anymore. The CPU time also dropped from ~15% to ~10%. That means that ~5% of CPU time was in the static Logger.Write(LogEntry) method. If you look at the graphs you’ll notice a common pattern among them, because I wanted to test with the same scenario to get as close to as measurable results as possible…but to illustrate how bad the EL’s performance can get, here’s one:
I literally fell off my chair when I first discovered this as I didn’t think it could be possible something that’s supposed to be non-invasive could end up taking this much CPU. This is one of the earlier tests I did where I didn't have a set scenario yet.
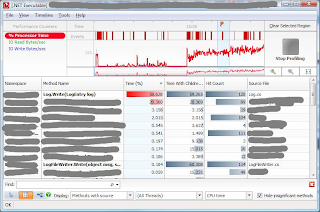
And of course, here are the results with log4net.
So what does that leave us?
log4net: 5%
EL static: 15%
EL instance: 10%
So what should you get out of this? Be very careful of how you invoke Logger.Write()…it may not be as cheap as you think it is. Even log4net took much more CPU time than I expected.
I redid the test using Castle’s logging framework, which is a barebones dump messages to a file. The total CPU time for this was 0.016%. Yep! I had to scroll down to even find it!
I guess this shows that even log4net, which is touted for high-performance, comes at a cost.
One of my recent tasks was hunting down a memory leak. So I downloaded the trial of the ANTS .NET Bundle which contains a memory profiler and performance profiler. Hunting the memory leak was a pain since I wasn’t the one who wrote the code, so it took a while for me to realize which objects were “leaked.” I eventually found it, and then I turned my attention to using the performance profiler to see if any obvious places could be optimized.
At this point I decided to swap in the Enterprise Logging Block to see how it would fair. The logging migration project was still in progress, and we haven’t made the full switch yet, but I figured I should try out it anyway because I’m the curious type.
The software already uses the Trace diagnostics extensively. Practically every message, error, you name it, will get Trace.WriteLined…and then a LogFileWriter will pick it up, and dump it to a file. In my testing, I simply added an extra line of code here, namely Logger.Write(LogEntry). Thus, anything that used to get logged, will also get logged by the EL.
Then, it was basically running the application to a similar set of scenarios, and then seeing what the profiler says. Obviously each run will not be exactly the same as the previous, but overall I think if we look at percentages we can begin to see where the CPU is taking the most time.
Here is what the application does without any modifications.

Yeah, I was pretty surprised too. That one method ended up being the most expensive method in the entire application.
A quick look at the source revealed quite a bit of code dedicated to thread safety. So digging deeper, I decided to avoid the static Logger.Write method altogether, create instance LogWriters directly, and have them all go to a singleton FileTraceListener.

I literally fell off my chair when I first discovered this as I didn’t think it could be possible something that’s supposed to be non-invasive could end up taking this much CPU. This is one of the earlier tests I did where I didn't have a set scenario yet.
And of course, here are the results with log4net.

So what does that leave us?
log4net: 5%
EL static: 15%
EL instance: 10%
So what should you get out of this? Be very careful of how you invoke Logger.Write()…it may not be as cheap as you think it is. Even log4net took much more CPU time than I expected.
I redid the test using Castle’s logging framework, which is a barebones dump messages to a file. The total CPU time for this was 0.016%. Yep! I had to scroll down to even find it!
I guess this shows that even log4net, which is touted for high-performance, comes at a cost.